Overview
Week 3 shifts the course from the single-device focus of Week 2 to the wider question of how to choose among very different classes of embedded-AI silicon and defend that choice with numbers. It opens by explaining why platform comparison is genuinely hard — peak TOPS is a ceiling rather than a promise, and performance is inherently multi-dimensional — then introduces five quantitative axes for honest comparison: TOPS-per-watt, latency (including its tail, distinct from throughput), area/resources, $/TOPS, and model-size limits. From there it surveys the five architectural families along a flexibility–efficiency spectrum (CPU, GPU, TPU/ASIC, MCU+NPU, and FPGA), before developing its analytical core: the roofline model, arithmetic intensity and weight reuse, and a worked, order-of-magnitude roofline for the PYNQ-Z2 (≈44 GOP/s over ≈2 GB/s, giving a ridge near 22 ops/byte). It closes with a structured, filter-in-order framework for selecting a platform under real constraints and a method for measuring latency and throughput directly on the PYNQ-Z2’s PS versus PL — setting up Lab 2.
Learning Objectives
By the end of this lecture, a student should be able to:
- Define the five comparison axes — TOPS/W, latency, area, $/TOPS, and model-size limits — and explain what each does and does not tell you.
- Explain why peak TOPS is a poor single-figure metric, and why achieved throughput on a real model matters more.
- Contrast the architectural character of CPU, GPU, TPU/ASIC, MCU+NPU, and FPGA platforms for edge inference.
- Compute arithmetic intensity for a layer, place it on a roofline, and determine whether a workload is compute-bound or memory-bound.
- Construct an approximate roofline for the PYNQ-Z2 and use it to predict where an accelerator design will be limited.
- Apply a structured decision framework to select a platform for a stated workload and set of constraints.
- Measure latency and throughput on the PYNQ-Z2 from a Jupyter notebook, and interpret the result honestly.
Why Platform Comparison Is Harder Than It Looks
Week 2 examined the internal architecture of one device — the Zynq-7020 — and the AXI channels that move data inside it. Week 3 zooms out: given a workload, how do you choose between the very different classes of silicon on the market, and how do you defend that choice with numbers?
The difficulty is that vendors compete on a single headline number, usually peak TOPS (tera-operations per second). Peak TOPS is a theoretical ceiling: it assumes every arithmetic unit is busy every cycle, with data always available. Real inference rarely comes close, because the accelerator spends much of its time waiting for weights and activations to arrive from memory. A platform quoting 4 TOPS may deliver a small fraction of that on your network — and a different platform quoting fewer TOPS may beat it.
Two consequences shape the whole lecture. First, always distinguish peak from achieved performance, and prefer measured latency on your own model over any datasheet figure. Second, comparison is multi-dimensional: a platform that wins on throughput may lose badly on power, unit cost, or the maximum model size it can hold. The engineer’s job is to state the constraints first, then find the platform that satisfies all of them — not to maximise one number.
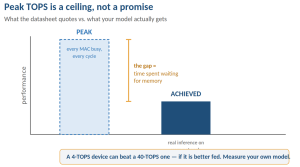
Figure 1. Peak TOPS assumes every arithmetic unit is busy every cycle; achieved performance on a real model is far lower. The gap is time spent waiting for memory — which is why a lower-peak device can beat a higher-peak one.